Who Benefits
A Year After the Middle Class Tax Cut, the Rich Are Winning – Bloomberg 12/18/18 “Most rich taxpayers, however, are doing much better this year. The alternative-minimum tax, or AMT, dreaded by affluent Americans, lost much of its bite in the legislation. The estate tax, previously paid by just two out of every 1,000 taxpayers who die, is now even easier to avoid. The law doubles the amount of wealth exempt from the levy, to $11 million for singles and $22 million for couples. The rich are already using the new limits to create dynasty trusts for generations of their descendants.”
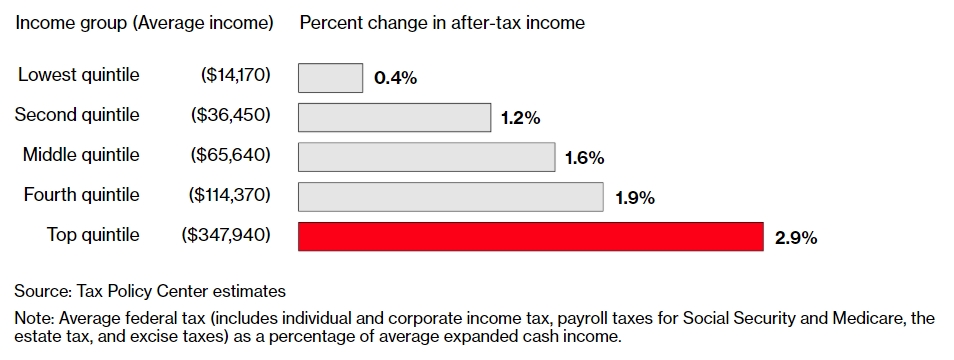
The benefits of this ‘strong economy’ have not reached all Americans – Washington Post 12/13/18
Trump’s Tax Cut One Year Later: What Happened? – NY Times 12/27/18
A Sober Look at the Economy – Washington Post 1/2/19
Unemployment & Workforce Participation – Tax Rate History – Earning Power – Poverty Rate – Feds Penalizing States – Income Inequality
Unemployment & Participation
U.S. Bureau of Labor Statistics “Charting the Labor Market” – source of the two charts below. (The download has about 20 charts.)
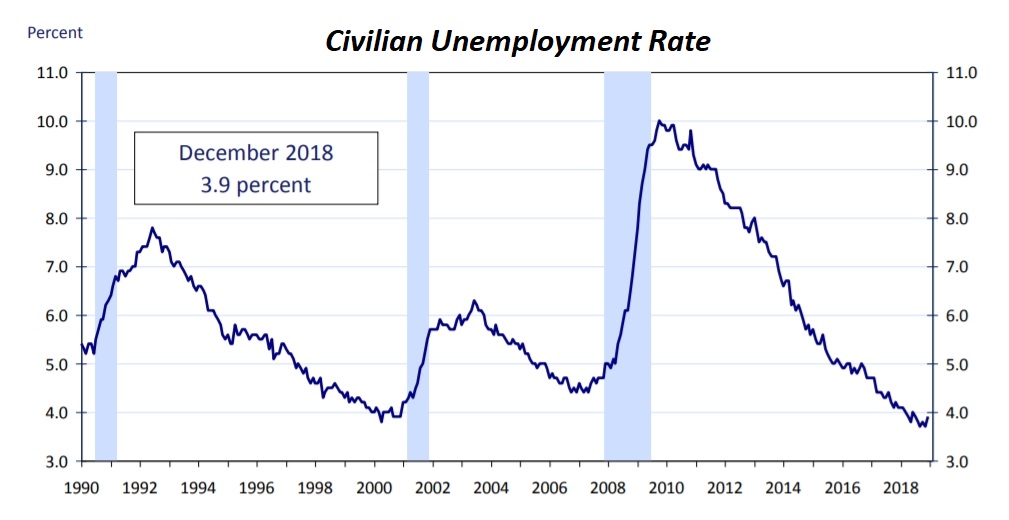
Unemployment began declining at a relatively constant rate with the 2008 financial crisis. Last year it leveled off at what most economists would consider full employment. There is no evidence that this 10 year continual improvement came as a result of the 2017 tax plan.
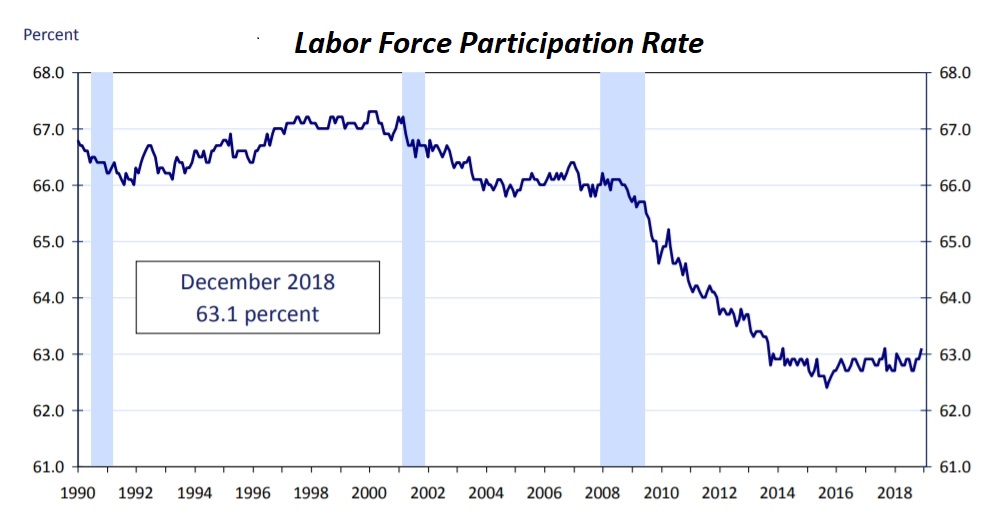
The participation rate (the percentage of the 16 to 64 population working or looking for work) began declining at a relatively constant rate with the 2008 financial crisis. It leveled off in 2014 and has not changed more than half a percentage point since then. A lot of people have dropped out of the labor force, leaving it at a level significantly lower than it was for decades before the 2008 financial crisis.
Tax Rate History
Tax Foundation “U.S. Federal Individual Income Tax Rates History, 1862-2013” and moneychimp.com “Federal Tax Brackets 2000 – 2019” – sources for table below.

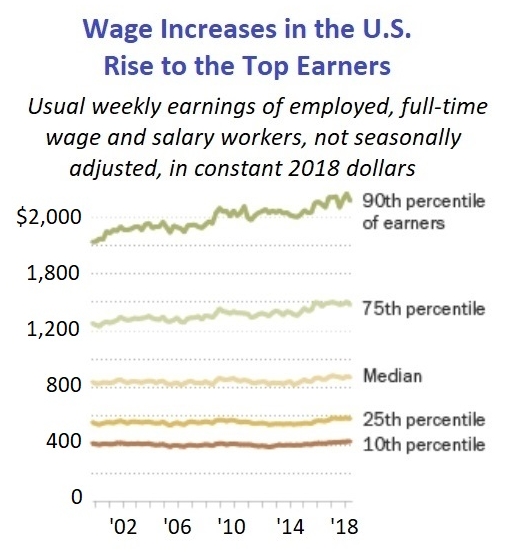
Earning Power
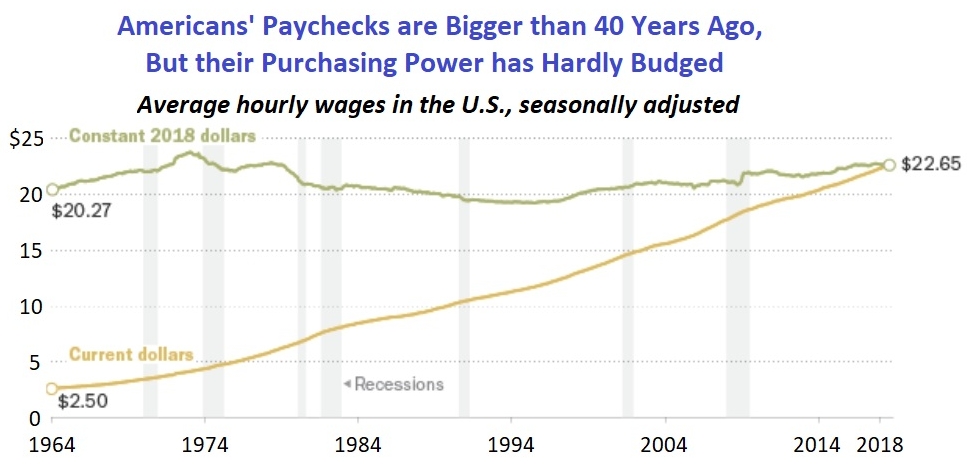
Pew Research “For most U.S. workers, real wages have barely budged in decades” – source of the following two charts.
Poverty Rate
U.S. Census Bureau “Historical Poverty Tables: People and Families – 1959 to 2017”
New data paint an unpleasant picture of poverty in the US – The Conversation 9/12/18
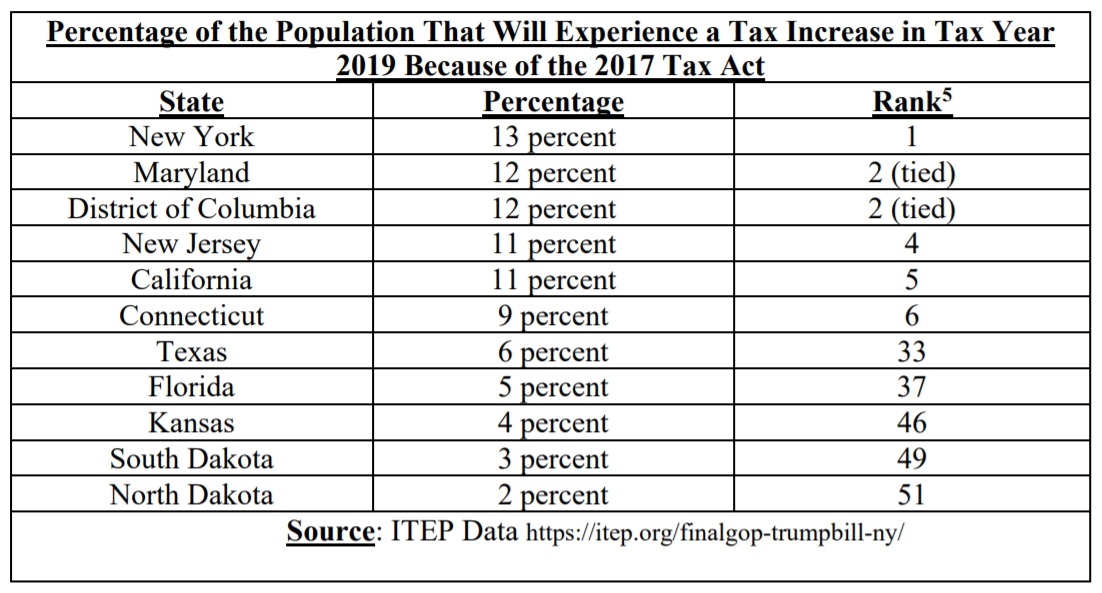
Feds Penalizing States
New Jersey, New York, Connecticut, and Maryland SALT Lawsuit Against 2017 Tax Act – includes the table below as an exhibit.
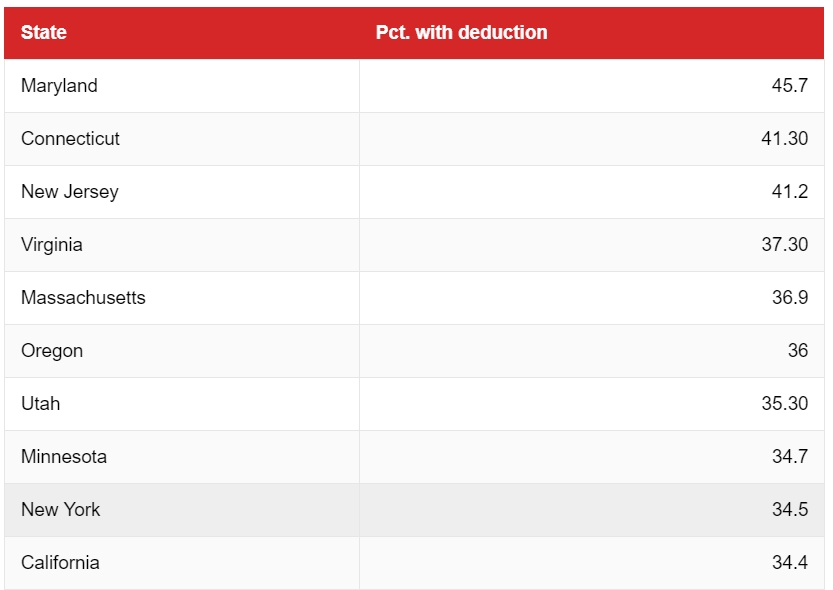
Trump says property tax deduction has rest of America subsidizing N.J. He’s wrong. – NJ.com 10/4/2017 – article includes the tables below of information from the Tax Foundation.

Income Inequality
The Gap Between CEO and Worker Pay Is Nearing Pre-Financial Crisis Levels – Fortune Magazine 8/16/18 “Indeed, while CEOs of the nation’s 350 largest companies earned about $18.9 million in 2017, a 17.6% raise from a year earlier, their workers’ paychecks increased roughly 0.3% during the same time period, according to a Thursday study from the Economic Policy Institute….As a result, those CEOs are paid on average 300 times more than their employees.” (not accounting for other CEO compensation)
CEOs aren’t disclosing their real compensation. The pay gap is much worse than you think. – USA Today 5/17/18 “From 1978 to 2016, inflation-adjusted CEO compensation for S&P 500 CEOs rose 937% while the typical worker’s real wages grew only 11%. Alone, the threat prospect of an excise tax pay might embolden boards to begin to control CEO pay escalation.”
As companies reveal gigantic CEO-to-worker pay ratios, some worry how low-paid workers might take the news – Washington Post 2/21/18 “Indeed, while CEOs of the nation’s 350 largest companies earned about $18.9 million in 2017, a 17.6% raise from a year earlier, their workers’ paychecks increased roughly 0.3% during the same time period, according to a Thursday study from the Economic Policy Institute….As a result, those CEOs are paid on average 300 times more than their employees.”
